GMAT Data Insights Section

The Data Insights section of the GMAT Focus Edition is a major part of the exam.
Unlike the previous GMAT format, where Integrated Reasoning (IR) was scored separately, the Focus Edition integrates IR into the Data Insights section.
This means that your performance here directly impacts your total GMAT score, making it as crucial as the Quantitative and Verbal sections.
Therefore, mastering Data Insights requires more than just familiarity with question types; it demands a strategic approach.
In this guide, we will explore the Data Insights Section, its scoring, question types, strategies to improve performance, common pitfalls to avoid, and best resources for preparation.
Overview of the GMAT Data Insights Section

The Data Insights section of the GMAT Focus Edition measures data literacy and analytical decision-making skills.
It replaces the old Integrated Reasoning section, combining Data Sufficiency questions that were previously part of the Quant section.
Format: Consists of 20 multiple-choice questions, to be completed in 45 minutes.
Score Range: Data Insights scores are reported on a 60–90 scale, which contributes to the overall GMAT Focus Edition score, ranging from 205 to 805.
How it’s Scored: The Data Insights score is based on three factors:
- The number of questions answered
- Whether the answers are correct or incorrect
- The difficulty and other parameters of the questions answered
Some questions may have multiple parts; thus, all parts of a question must be answered correctly to receive credit for that question.
Data Insights Skills Tested on the GMAT
The Data Insights section isn’t just about crunching numbers; it’s about showing you can think like a business leader in a data-driven world.
Each question is designed to test how well you interpret, connect, and act on information under pressure.
Here’s what you’ll be measured on:
- Data Interpretation & Analysis: Reading charts, tables, and text accurately, then extracting the key meaning without getting lost in detail.
- Information Synthesis: Pulling data from multiple sources and combining them into one clear answer. Often, that means blending numerical facts with written context.
- Analytical Reasoning: Spotting trends, patterns, and relationships hidden in the data — then reasoning through them systematically.
- Quantitative Reasoning: Applying core math skills (ratios, percentages, algebra basics) in a way that’s more about logic than heavy calculation.
- Critical Thinking: Testing whether arguments and conclusions actually hold up when you look at the evidence.
- Decision-Making: Choosing what matters, discarding what doesn’t, and selecting the best-supported conclusion, just like in real business scenarios.
- Reading & Visual Comprehension: Understanding text, graphs, and visuals side-by-side, and combining them to solve complex problems.
Unlike Quant or Verbal, Data Insights forces you to use these skills in combination, reading critically while analyzing numbers, or applying math while evaluating an argument.
That integration is exactly what MBA programs and employers want to see: proof that you can solve messy, real-world problems with clarity.
GMAT Data Insights Question Types
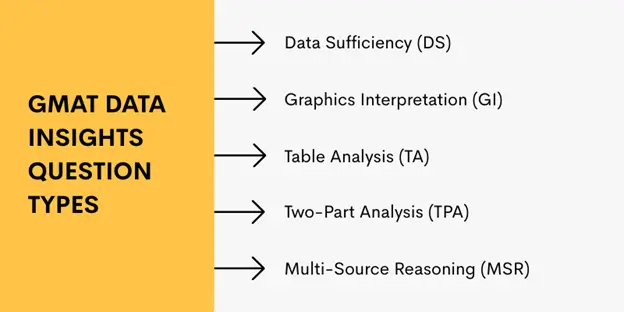
The Data Insights section in the GMAT Focus Edition combines reasoning, data interpretation, and decision-making.
To succeed, you need to be fluent in the five key question formats, each demanding a slightly different mindset.
Here’s what you’ll face and how to approach them:
1. Data Sufficiency (DS)
Data Sufficiency is a classic GMAT question that now lives in the Data Insights section.
These questions present a problem and two statements of information. Your task is not to fully solve the problem, but to decide if the information given is sufficient to answer the question definitively.
Data Sufficiency tests your quantitative reasoning and judgment in determining what data is needed.
Importantly, it requires understanding the concepts of “sufficient” vs. “insufficient” data, and often involves basic mathematical and logical reasoning.
For example, can statement (1) alone answer the question? Can statement (2)? Or do both together, or none at all?
Given this, these questions demand strong analytical thinking to avoid unnecessary calculations and focus on what’s needed to solve a problem.
2. Graphics Interpretation (GI)
Graphics Interpretation questions ask you to work directly with visual data such as charts, graphs, or diagrams.
Instead of just reading numbers, you’ll need to interpret what the visual actually shows, spot trends, and sometimes calculate a percentage or ratio change.
For example, you might be asked to complete a fill-in-the-blank statement like, “Between 2010 and 2020, X increased by approximately ___%.”
These questions are less about advanced math and more about careful reading.
Thus, a small misstep, such as overlooking an axis label or misreading a scale, can lead to an incorrect answer.
That’s why the best strategy is to slow down, check titles and legends carefully, and use estimation when possible instead of leaning too heavily on the calculator.
3. Table Analysis (TA)
Table Analysis gives you a sortable spreadsheet-style dataset and asks you to judge whether several statements are true or false.
The skill being tested here is your ability to filter large amounts of information and identify exactly what’s relevant.
You’ll often need to calculate averages, percentages, or comparisons, but the real challenge lies in accuracy: there is no partial credit.
If you get even one of the three statements wrong, the entire question is marked incorrect.
Successful test-takers learn to use the sorting function strategically, allowing them to bring the most useful rows or columns into view.
Once you’ve identified the relevant data, double-checking every statement becomes essential before you lock in your answer.
4. Two-Part Analysis (TPA)
Two-Part Analysis questions present a problem with two interconnected parts that you must solve together.
You’ll typically see a table of answer choices arranged in columns, and you need to select one response from each column that forms a consistent pair.
Sometimes the task is quantitative, such as solving for two variables; other times it’s verbal or logical, or even a mix of both.
The difficulty here is that many answer choices may appear correct when viewed separately but fail to hold up as a pair.
Remember, the key is to approach these problems systematically, testing combinations and eliminating inconsistent matches until you find the solution that works across both parts.
Also, careful reasoning and, at times, creative trial and error are the tools that make TPA manageable.
5. Multi-Source Reasoning (MSR)
Multi-Source Reasoning questions present information across multiple tabs or sources, such as an email, a chart, and a report, then ask you to answer several questions tied to that set of data.
The challenge isn’t simply understanding the information but managing it, deciding which source to consult for each question, and piecing together insights without wasting time.
Since you’ll often face three questions per scenario with only seven to eight minutes to complete them, efficiency is critical.
The best approach is to skim all the sources first, take mental notes on what type of information each contains, and then use keyword scanning to quickly locate relevant details when answering.
This format simulates the real-world business environment where leaders must sift through overwhelming information to find what actually matters.
Across these question types, expect a balanced mix in the exam.
In the Focus Edition, about 20–40% of Data Insights questions are Data Sufficiency (a significant chunk), while the remaining question types each make up roughly 10–20% of the section.
This means you’ll see several DS questions and a handful of each IR-style question type.
Therefore, be prepared to switch between quantitative thinking and verbal/data interpretation seamlessly.
Also, note that, unlike the Quant section, an on-screen calculator is allowed in Data Insights.
Gurutor trains you across all five Data Insights question formats.
Each module breaks down the logic behind the question, shows you the shortcuts experts use, and gives you instant feedback when you slip.
That way, you’re not just “familiar” with the question types, you’re confident in how to attempt each one under time pressure.
How Scoring Works for GMAT Data Insights Section
On the GMAT Focus, the Data Insights section is scored between 60 and 90, just like the Quantitative and Verbal sections.
But GMAT scoring isn’t just about counting correct answers; it’s about how you perform under the GMAT’s adaptive testing model.
Here’s a detailed breakdown of how scoring works in the Data Insights section:
- Adaptive Scoring System
The exam is computer-adaptive, meaning the difficulty of the next question depends on your performance in real time.
Answering early questions correctly brings progressively harder questions, which carry more weight in determining your score.
- Accuracy and Difficulty Relationship
Correctly answering harder questions has a larger impact on your score than answering several easier ones correctly. This makes accuracy on tougher problems especially valuable.
Penalties for Unanswered Questions: Failing to complete the section can cause a major drop in your score. Effective pacing and time management are critical to ensure you attempt every question.
- Partial Credit Possibilities
Some multi-part questions allow for partial credit if you correctly solve at least one part.
Always attempt every part of the question, even if you’re unsure about the entire problem.
- Strategic Answering
Never leave a question blank. Even an educated guess improves your odds of earning points.
Also, try to eliminate clearly wrong answers to maximize your chances when uncertain.
Given this, mastering this scoring system requires balancing speed, accuracy, and strategy to maximize your Data Insights score.
Strategies for Improving Data Insights Score
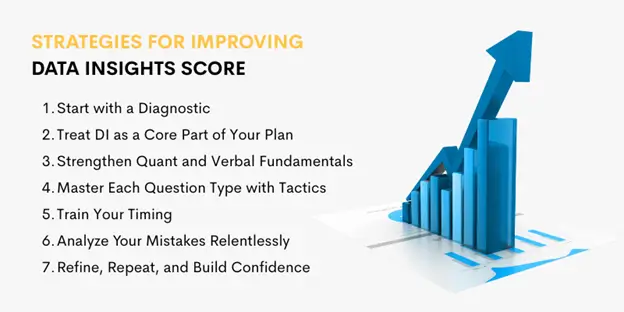
With the right GMAT preparation strategy, you can steadily raise your score and turn this section into an advantage.
Here’s how to train like a high scorer.
1. Start with a Diagnostic
The smartest first step is to measure your current standing. Take a GMAT Focus practice exam or a diagnostic set that includes Data Insights.
This will reveal your strengths and weaknesses, maybe you’re comfortable with Data Sufficiency but struggle with Multi-Source Reasoning.
Knowing your baseline accuracy and timing provides a clear map for what to prioritize in your preparation.
2. Treat DI as a Core Part of Your Plan
Don’t push DI to the side while focusing only on Quant and Verbal. Build it into your study plan from the start.
Create a structured plan to dedicate a week at a time to each question type, incorporating timed practice.
Set measurable goals, like “hit 80% accuracy in Graphics Interpretation” or “cut Table Analysis time to under 3 minutes.”
For working professionals or retakers, this kind of structure ensures every hour of study moves you closer to your target score.
3. Strengthen Quant and Verbal Fundamentals
Data Insights draws directly from the Quant and Verbal skills you’re already building.
Think of it as an integration test: you’ll use algebra, number properties, and percentages in Data Sufficiency, and critical reasoning or reading comprehension in Multi-Source Reasoning.
The stronger your fundamentals, the less mental energy you waste on basics during DI.
Also, fold DS practice into your Quant review and apply verbal logic skills to DI prompts that involve text-heavy data.
4. Master Each Question Type with Tactics
Every format has its quirks, so it pays to study them tactically.
Learn to scan graphs efficiently for Graphics Interpretation. Practice sorting tables quickly for Table Analysis.
Use elimination grids to crack Two-Part Analysis pairs. And for Data Sufficiency, train yourself to stop solving, focus only on sufficiency.
Multi-Source Reasoning is best handled by skimming all sources up front, then pulling information with precision.
When you practice, note the traps you fall for and write them down. Over time, you’ll recognize them before they catch you.
5. Train Your Timing
You’ll have 20 questions in 45 minutes, just over 2 minutes per question.
But the pacing is uneven: some questions (like DS) are answered quickly, while others (like MSR sets) require more time.
That’s why timed practice is essential. Start without a timer to learn the mechanics, then move to small timed sets, and finally simulate the full 45-minute section.
For this, use the review feature on the real exam strategically: you can mark up to three questions to revisit, which buys you flexibility if you hit a time sink.
6. Analyze Your Mistakes Relentlessly
What you do after practice matters more than the practice itself.
Review every error and ask why you missed it, was it a misread graph axis, a percentage calculation, or a logic slip in MSR?
Keep an error log organized by question type and concept. If you notice patterns, such as frequent misses on table-based percentage problems, drill those until the weakness disappears.
Over time, this kind of targeted review closes gaps far faster than mindless repetition.
7. Refine, Repeat, and Build Confidence
As exam day approaches, review question types that still feel shaky. Re-do questions you missed weeks ago to confirm the mistake is truly fixed.
Utilize official explanations and trusted prep resources to study not just the correct answer, but also the most efficient method.
Take full-length practice tests to monitor your Data Insights score relative to Quant and Verbal, and adjust your final study blocks based on what’s lagging.
Done right, your gains here will ripple into Quant and Verbal as well, since the section tests integrated reasoning skills.
And the good news? Gurutor already builds this into your GMAT prep.
Each session trains you on official-style DI questions with instant feedback, performance tracking, and error fixes. You’re not just solving data problems — you’re practicing the habits of high scorers.
Common GMAT Data Insights Pitfalls & How to Avoid Them
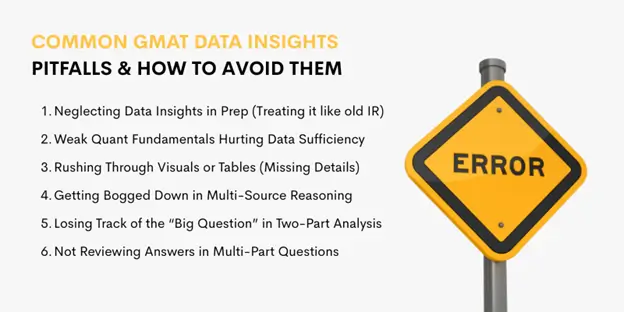
Even with strong preparation, many test-takers stumble in the Data Insights section due to small but costly mistakes.
The good news? Most of these pitfalls are avoidable if you know what to watch out for.
Here are the most common traps, and the strategies to sidestep them:
1. Neglecting Data Insights in Prep (Treating it like old IR)
Many students either skip focused DI prep or postpone it until the very end when studying for the GMAT, assuming it’s less important. This comes from the old GMAT format, where Integrated Reasoning didn’t affect your 800.
But in the Focus Edition, DI is one-third of your total GMAT score. Give DI the same respect you give Quant and Verbal.
Build DI practice into your prep from the start, so you’re comfortable with the unique question types and mental shifts required. Treat it as core, not optional.
2. Weak Quant Fundamentals Hurting Data Sufficiency
Many test-takers get Data Sufficiency wrong, not because they can’t handle sufficiency logic, but because their Quant basics aren’t solid.
Messy arithmetic or shaky algebra will sink you before logic even comes into play.
Thus, strengthen your Quant fundamentals and apply them directly to DS. Learn the DS answer choice framework and drill the “sufficiency mindset.”
Remember, the goal isn’t to solve for an exact value; it’s to check whether the information provided could lead to an answer.
3. Rushing Through Visuals or Tables (Missing Details)
Under time pressure, it’s tempting to skim graphs and tables, but this often leads to missing key details, such as units, footnotes, or axis scales.
Thus, slow down just enough to orient yourself. Read legends, labels, and scales carefully.
Ask yourself: “What’s this visual really showing?” before jumping to the question. Those 5–10 seconds of careful reading can save you from big mistakes.
4. Getting Bogged Down in Multi-Source Reasoning
MSR sets can feel overwhelming, and students either read every word (wasting time) or dive into questions blindly (leading to chaos).
Skim each tab first to familiarize yourself with its contents, then proceed question by question.
Always ask: “Which tab(s) matter for this?” Stay focused on one question at a time and manage pacing, aiming for around 2.5 minutes per MSR question.
5. Losing Track of the “Big Question” in Two-Part Analysis
It’s easy to solve one half of a TPA problem and forget the other, or to lose sight of what the question is really asking.
Before solving, write down the two outputs you need. Keep checking back: “Have I answered both parts?”
When reviewing choices, think in pairs; the correct answers must work together.
6. Not Reviewing Answers in Multi-Part Questions
In GI, TA, and TPA, if one part is wrong, the whole question is wrong. Many students confidently answer the first part but forget to double-check the rest.
Therefore, treat each multi-part question as unfinished until you’ve verified every part.
For this, quickly scanning to confirm consistency and catch misreads can save you valuable points. Since there’s no partial credit, this step is critical.
If you avoid these pitfalls, you’ll put yourself in a strong position to excel.
Resources to Boost Your Data Insights Score
To perform at your best in the Data Insights section, you need more than just practice; you need the right study resources.
1. Official GMAT Materials
Always start with the source. The GMAT Official Guide (Focus Edition) and GMAC’s Official Practice Exams are essential.
They give you real exam-style questions, an adaptive test experience, and familiarity with the exact interface you’ll see on test day.
2. GMAT Prep Books
They provide comprehensive coverage of concepts, practice questions, and strategies, often with detailed explanations to strengthen problem-solving skills.
While they can’t replicate the adaptive nature of the real test, high-quality prep books, especially those that include official GMAT questions, are an excellent supplement to digital practice tools and can help build both knowledge and confidence.
3. Gurutor – A System That Works Like a Tutor, 24/7Gurutor
Unlike traditional prep platforms that simply hand you a pile of lessons, Gurutor provides a step-by-step system that shows you how to study, not just what to study.
With built-in pacing, instant feedback, and adaptive guidance, it delivers GMAT tutor-style support every time you practice.
No scheduling hassles, no hidden costs — just consistent, expert-designed guidance whenever you need it.
4. Study Groups & Discussion Forums
Joining study groups, GMAT coaching classes, and participating in GMAT forums can be an effective way to stay motivated and learn from others facing similar challenges.
While discussions can be insightful, it’s important to filter advice carefully, as not all shared methods may align with the GMAT’s testing logic.
FAQs About GMAT Data Insights
What is the Data Insights section on the GMAT Focus Edition?
Data Insights is a 45-minute section on the GMAT Focus Edition, replacing the previous Integrated Reasoning section. GMAT consists of 20 questions that test your ability to analyze and interpret data from charts, tables, text, and other sources.
You’ll encounter five types of questions: Data Sufficiency, Multi-Source Reasoning, Table Analysis, Graphics Interpretation, and Two-Part Analysis, all aimed at evaluating how well you can draw conclusions and make decisions based on various forms of data. Unlike the previous IR section, Data Insights counts toward your total GMAT score.
Does the Data Insights section count toward my total GMAT score?
Yes. In the GMAT Focus Edition, Data Insights is one of the three equally weighted sections (with Quant and Verbal) that make up your total score. Unlike the classic GMAT, where Integrated Reasoning was separate, Data Insights now directly impacts your 205–805 score; strong performance boosts your overall result, while weak performance lowers it.
Can I use a calculator on the Data Insights questions?
Yes. You can use an on-screen calculator in the Data Insights section of the GMAT Focus Edition, but not in Quant. It’s useful for calculations, though many DI questions focus more on reasoning than math, so practice with it beforehand to save time on test day.
Is Data Insights the same as Integrated Reasoning, or what’s different?
Data Insights isn’t brand new; it’s the evolved version of Integrated Reasoning. It supports all IR formats (Graphics, Tables, Two-Part, and Multi-Source) but now also includes Data Sufficiency, which was previously part of Quant. The big shift? In the Focus Edition, DI is no longer a side score, but rather fully part of your composite score, weighted like Quant and Verbal. That means schools take it just as seriously.
Conclusion
The GMAT Data Insights section isn’t just another hurdle; it’s a chance to prove you can think the way top business schools expect.
Excelling here means showing you can interpret data, reason under pressure, and apply insights the way future managers do.
With the right GMAT strategy, consistent practice, and feedback-driven prep, you can turn Data Insights from a challenge into one of your strongest scoring areas.
Master it, and you’re not only raising your GMAT score, you’re building the decision-making edge that will carry you through business school and beyond.
Master GMAT Data Insights with Tutor-Level Feedback
Gurutor trains you on every Data Insights problem with step-by-step reasoning, instant feedback, and smarter strategies. The result? You learn faster, avoid repeating mistakes, and steadily raise your score.
Start your free unit today!